

How to measure brand experiences without confusing signals
How to measure brand experiences is a question about decisions, rather than filling a dashboard. Before counting attendees, posts or forms, define what you wanted a person to understand, try or ask. Then choose observations that address that goal.
The same activation can generate much movement and little learning; it can also produce few interactions yet reveal an important barrier to use.
This article separates seven families of signals so each retains its meaning. Do not add them into a magic number. Define the observation unit, period, denominator and source of each data item. If you are considering follow-up, first explain its purpose and the permission needed.
The guide to experiential marketing tactics helps choose an interaction that can later be evaluated with specific questions.
How to measure brand experiences: the goal first
Before a brand experience, write down what decision you want to make when it ends. Perhaps you need to know whether the demonstration is understood, what objections arise or whether the journey allows participation without difficulty. That question helps choose what to observe and avoids gathering figures without a defined use.
Establish how you will record information and for what period. The team should use the same definitions: approaching, starting an activity and finishing it are different facts. If each person counts them differently, the total will be difficult to interpret.
A measurement sheet can fit in five lines: goal, observed event, unit, source and limit. If the goal is to check whether a demonstration is understood, “people present” is context; “people who complete the task without help” comes closer to the question.
Even that data item requires recording what counted as completion, whether help was offered and what was left out. The team should agree on it before opening the doors, rather than reconstruct it after seeing the results.
The baseline matters when comparing versions. You can first rehearse with the team or a small sample to learn which instructions raise questions; that does not demonstrate that the general audience will behave alike. If the place, invitation and activity change simultaneously, do not attribute a variation to a single element.
Documenting those conditions makes the report useful, even if the conclusion is provisional.
Signals answering different questions
Select only signals related to your goal. Do not add them as though they were a single success measure: a mention, a sample delivered and a purchase describe different actions.
First family: in-person participation. Distinguish visible invitations, people approaching, those starting and those finishing an activity. Use the same period for numerator and denominator; avoid dividing completions from one hour by visitors from the whole day. Second family: conversation and questions. Group recurring questions by topic without turning a striking phrase into a representative opinion.
What was said helps redesign instructions, but does not replace formal research.
Third family: mentions and shared content. A post may show potential reach, rather than understanding or attendance. Fourth family: samples or materials delivered. Count deliveries and replenishments, but do not assume subsequent use. Fifth family: voluntarily declared data. A survey or contact request serves its own purpose; consent for one does not grant permission for another.
In all five, preserve provenance and avoid mixing people, sessions and actions.
Sixth family: digital behaviors. If a page accompanies the experience, events such as visits or submitted forms can describe actions in that channel. The official Google Analytics guide to setting up events explains that technical distinction; it does not imply GX has that measurement active here. Seventh family: commercial continuity and sales. Record explicit requests and subsequent stages separately.
Temporal coincidence between an activation and sales does not demonstrate causality or allow every sale to be attributed to an in-person contact.
- Public mentions: which conversations about the experience you can identify, without confusing them with its entire reach.
- Voluntary registrations: how many people requested a next step, without assuming they are already customers.
- Samples: what was delivered and what was actually tried, when distinguishing them is possible.
- Audience responses: which questions or opinions repeat in conversations or surveys.
- Journey: where waits, departures or observable difficulties appear.
- Sales: which transactions you can verify and what relationship to the activity you can demonstrate.
- Direct participation: which actions attendees started or completed.
Separate the count from its interpretation
A person can participate several times or share several posts. That is why you should indicate whether you count people, sessions or actions. When presenting a proportion, explain which group it comes from and what was left out. A percentage without that reference may appear more precise than it really is.
Qualitative notes also need context. Record the question raised and when it arose. Do not turn an isolated observation into a conclusion about the entire audience.
The denominator is the least showy part and one of the most important. “Fifty completions” changes meaning if the activity started with sixty people or a thousand. Specify who had an actual opportunity to participate and who was excluded by schedule, capacity or access.
If the same person tries again, decide whether you count attempts or people and do not change criteria halfway through the report. Repeated openings of a frequently asked question do not equal unique readers either.
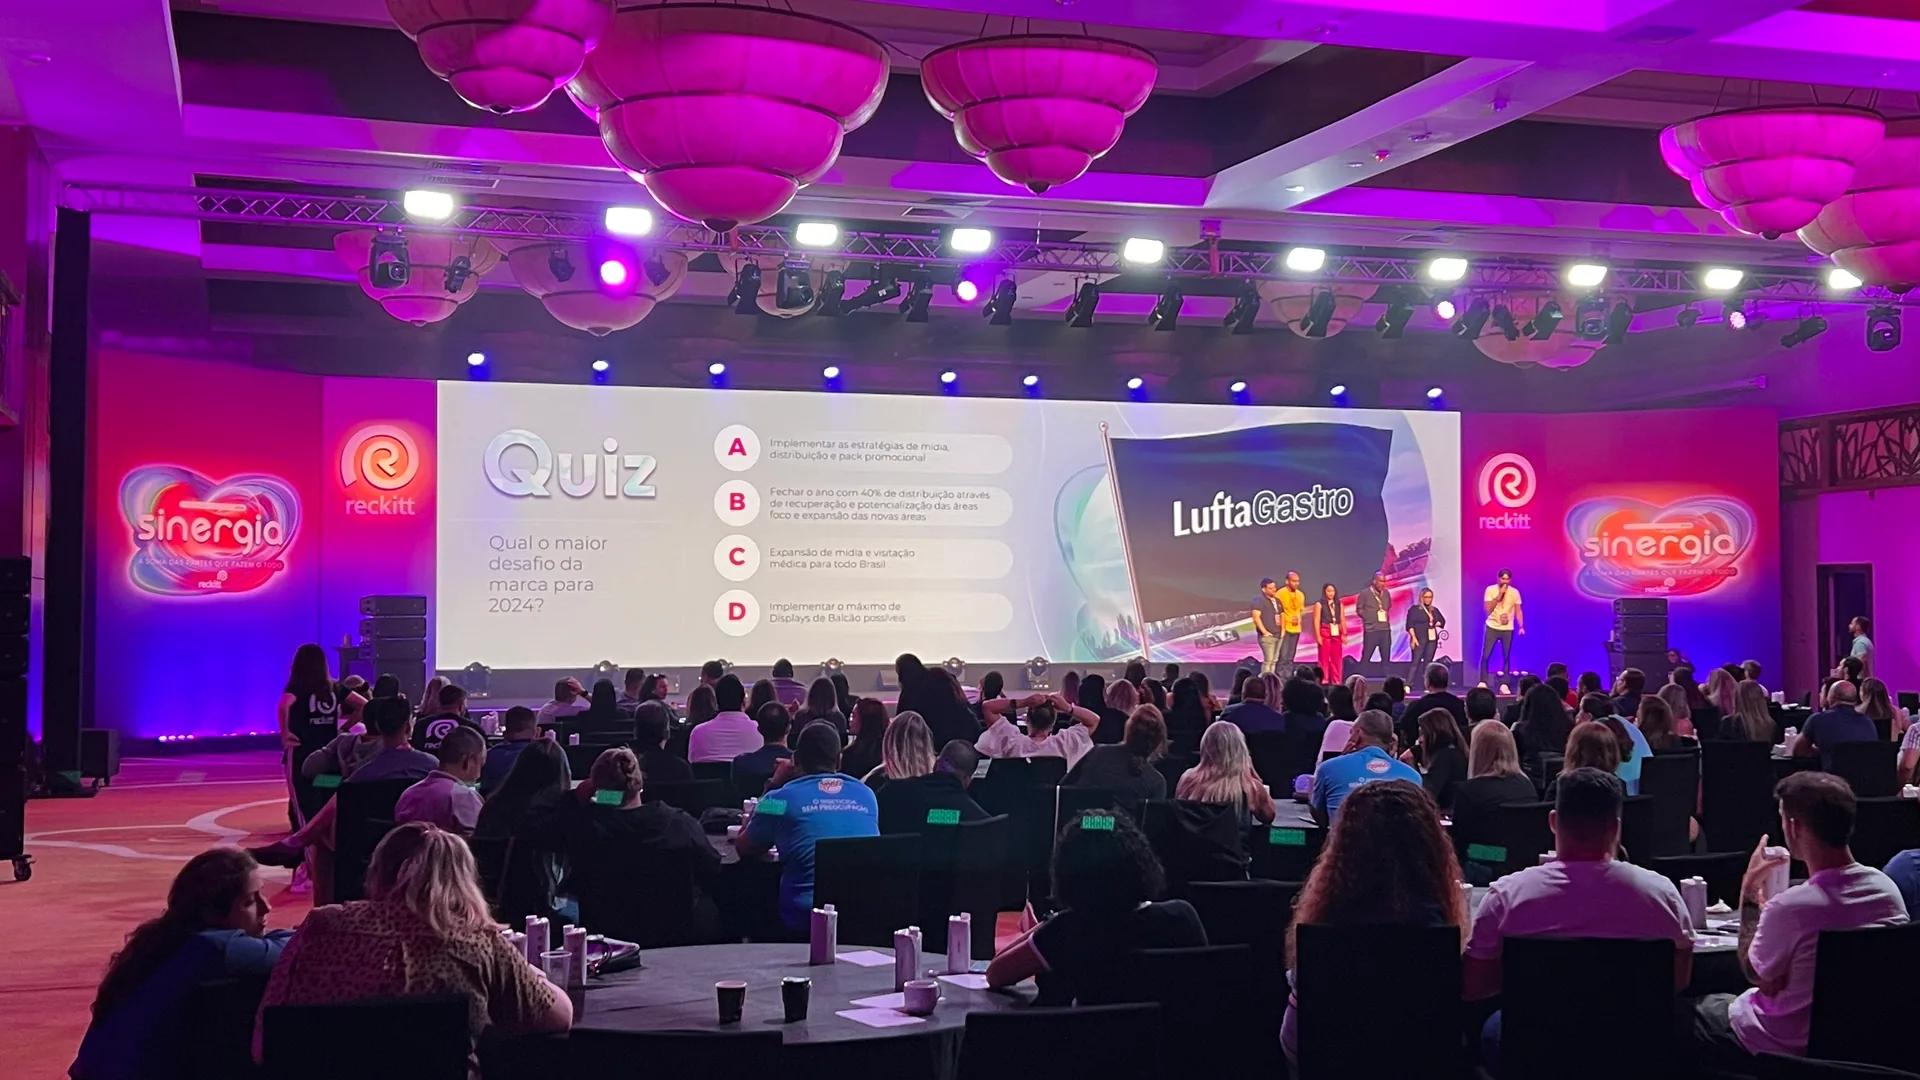
Present counts and proportions together when both are useful. A high percentage with a small group may be unstable; a large total without context can conceal friction. Always include the observation period and a note on missing data. A photograph of a full room can document atmosphere, but does not replace defined records or testimonials obtained for a clear purpose.
Acknowledge what you cannot attribute
A change in sales during an activation does not, on its own, demonstrate that the activation caused it. Promotions, price changes, availability or communication in other channels may coincide. Document those conditions before presenting an explanation.
Likewise, an enthusiastic reaction does not equal future loyalty. If you lack sufficient evidence, present the finding as a signal worth following up and specify what information is missing.
Attributing a change requires a comparison that controls alternative explanations. If requests increased after the event, review whether there were advertisements, discounts, a commercial date or product changes. Without that analysis, write “it was observed afterward,” rather than “the event caused it.”
In campaigns with several touchpoints, a person may arrive through a post, participate live and decide weeks later. A single scanned code does not reconstruct that entire trajectory.
Technical precision does not create permission either. An identifier, a Wi-Fi session or an email match does not authorize joining histories across surfaces. Preserve the purpose, origin and expiration of consent before linking data to follow-up. In an editorial report, acknowledging a limit is better than building an attribution impossible to defend.
That caution leaves more useful questions open for the next test.
Close with an improvement decision
Bring the team together to compare records with the initial goal. Identify which part of the experience worked according to the agreed criterion, what made participation difficult and what should be tested differently.
Prioritize observations obtainable without personal data. If you are considering surveys or follow-up, define their purpose and scope first. The final report should leave a specific decision, rather than just a collection of indicators.
The report's closing should answer “what do we change?” Choose an improvement in signage, a message clarification or a journey adjustment, and define what observation would show whether it helped. Also record what you will not change yet because evidence is lacking.
This makes measurement an understandable learning cycle for those designing and operating the experience, rather than a competition of figures.
A subsequent conversation can add context to a figure, provided it is not confused with a representative sample. Describe who responded, how they were invited and what questions were asked. If someone revokes contact permission, that decision should stop follow-up before any message; retaining a revocation note is not enough.
The report can preserve authorized aggregate metrics without turning every interaction into a commercial dossier.
A measurement sheet that leads to a decision
For each signal, write a reading line: “we observed X during Y, among Z defined opportunities; this suggests A, but does not demonstrate B”. Then record who can check it and what specific change will be made in the next version. The guide to planning a brand event connects that decision with agenda, team and rehearsal.
You do not need to publish a dashboard to discover that an instruction needs rewriting or an activity takes too long.
Always separate three layers: the prior hypothesis, the event actually observed and the result you can attribute with sufficient evidence. A simulation hypothesis is not telemetry; a recorded request does not equal a sent message; declared interest is not an approved commercial opportunity. Maintaining those boundaries lets you learn without promising more than the data show.
From signal to decision

Technical guides consulted
Google Analytics, Set up events: official documentation on digital events and parameters. It is consulted to define web-channel actions, rather than as evidence of active GX instrumentation.
W3C WAI, Making Events Accessible: reference for considering participation and access conditions when interpreting who had an opportunity to complete an activity.
These guides explain specific technical criteria. They do not prove the article's editorial thesis, commercial results or an active GX implementation.
Frequently asked questions
What is the first figure I should choose?
None before defining the decision. Describe what you need to learn and select an observable action that answers that question.
Does a person opening a page several times count several times?
They may generate several events. The report should distinguish events, sessions and people; do not assume they are equivalent.
Can I attribute sales to the event if they increased afterward?
Temporal sequence does not demonstrate causality. Review other campaigns, price changes, availability and the entire journey before formulating an attribution.
What do I do with data from someone who revoked consent?
Stop follow-up for the revoked purpose according to the applicable contract. Authorized aggregate metrics and operational history have different rules.